

Calculating business hours between activities using DAX
Whenever you're working with event data, you often have data on activities performed, and the time at which they were performed. This data is useful for process mining, where you can track durations of cases that follow a process, identify bottlenecks in the process and identify instances where the intended process is not followed. In this article, I'll walk you through how you can track the time between events, so you can note how long something spends in a given state.
Our challenge
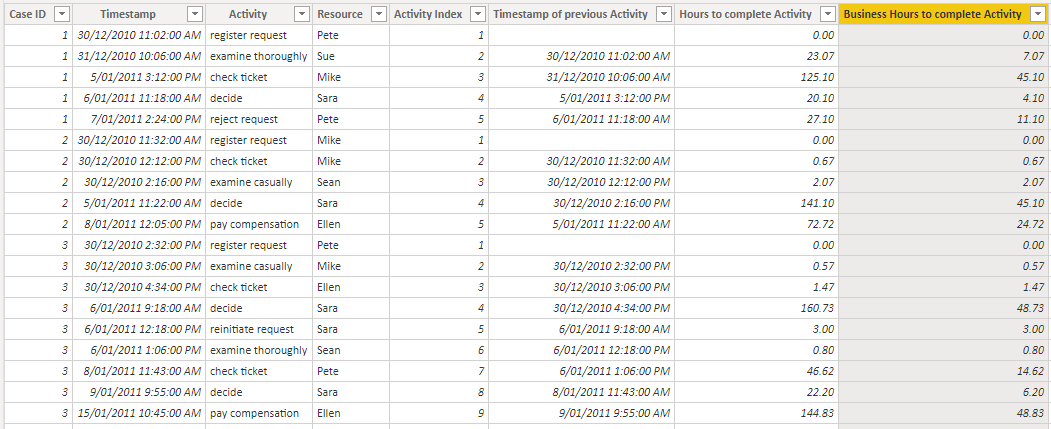
Here we have an event log which describes a compensation request process for an airline 1 . Each row represents an activity for a particular case, with the time of the activity and the airline staff member undertaking the activity also recorded.
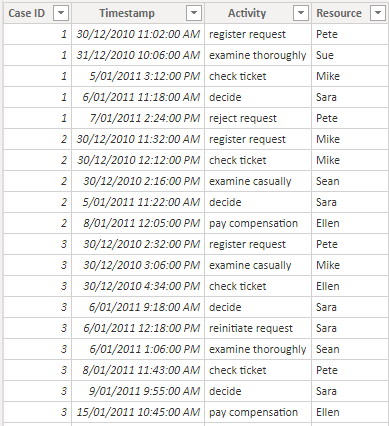
Using the timestamp for each case, we can trace the history of activities that each request moves through. For example, the first case has it's request registered and examined, then once the airline ticket is checked, a decision is made to reject the request.
If we want to understand this process in more detail, we may want to know how long each request spent waiting to complete this activity since the previous one was performed. In a simple linear process, this corresponds to the time spent in each state, where the states might be called something like 'waiting on ticket check', 'waiting on decision', etc 2 .
To determine the time between activities, we will tackle this in three steps by creating three calculated columns...
Create an index that orders the events in time for each case.
Use this index to determine the timestamp for the previous event in the process.
Calculate the time between these two timestamps, represented as either hours elapsed or business hours elapsed.
Adding an Activity Index
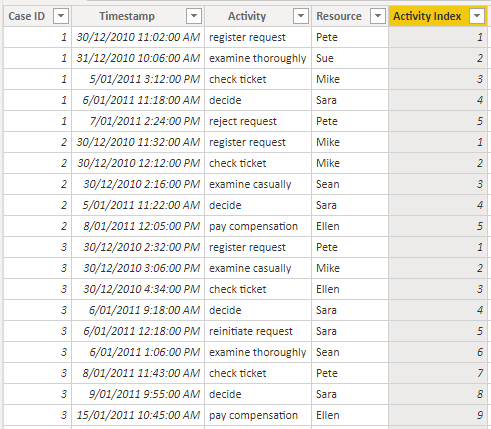
For this column, we will use the RANKX function to define the order in which each activity occurs. This will be done separately for each case, so that the first activity for each case (‘register request’) will always be indexed as 1.
VAR CurrentCase = 'Event Log'[Case ID]
RETURN
RANKX (
// Rank activities
CALCULATETABLE (
'Event Log',
REMOVEFILTERS ( 'Event Log' ),
// Look at all rows, not just current row
'Event Log'[Case ID] = CurrentCase // Filter down to just this Case ID
),
'Event Log'[Timestamp],
,
ASC,
// Order datetime ascending
DENSE // Dense rank, so that simultaneous events don't cause index to skip
)
And here’s what our result looks like…
Adding Timestamp of previous Activity
For this column, we will create a lookup to the previous activity by referencing the previous index for each case.
VAR CurrentCase = 'Event Log'[Case ID]
VAR CurrentIndex = 'Event Log'[Activity Index]
VAR PreviousIndex = CurrentIndex - 1
RETURN
CALCULATE (
SELECTEDVALUE ( 'Event Log'[Timestamp] ),
REMOVEFILTERS ( 'Event Log' ),
// Start from all activities
'Event Log'[Case ID] = CurrentCase,
// Filter to just current case
'Event Log'[Activity Index] = PreviousIndex // Filter to next case only
)
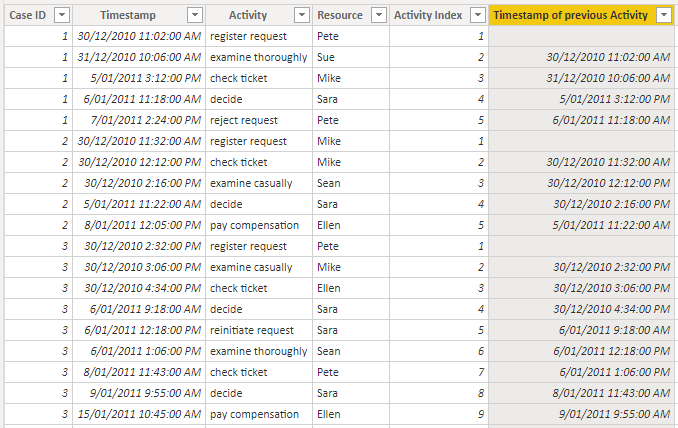
Note that we have a blank timestamp for the first activity in each case, since we’re not concerned how long the customer took to register their request.
Adding Hours to complete Activity
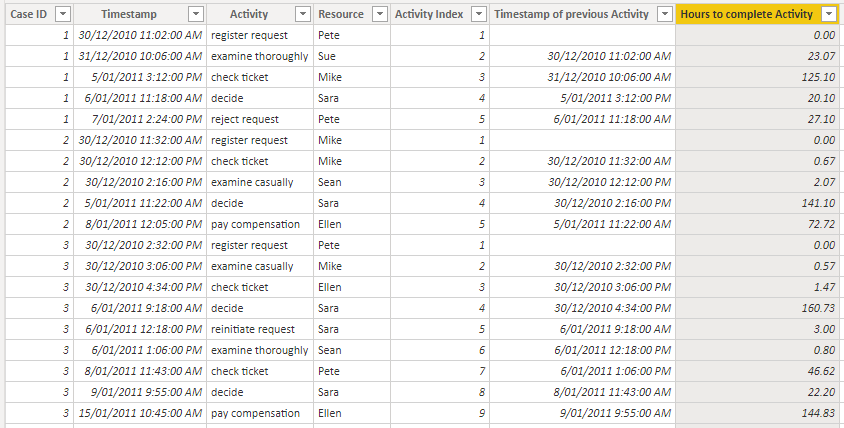
For this column, we’ll report the hours between activities, since that is a suitable time scale for this event log. Different types of processes will have better-suited timescales, e.g. tracking a user’s clicks on a website is best described in seconds, whereas milestones in a large project are better described in days or weeks.
We’ll also ensure that we track hours as a decimal rather than an integer, so that if we aggregate this value then we will get more accurate results. We can accomplish this by calculating the time difference in units of seconds, then converting to hours.
DIVIDE (
DATEDIFF (
'Event Log'[Timestamp of previous Activity],
'Event Log'[Timestamp],
SECOND
),
// Seconds between timestamps
60 * 60 // Convert seconds to hours as a decimal
) + 0
// Mark final activity as having zero duration
Representing as Business Hours to complete Activity
In a real world scenario, you may not be concerned about the hours spent waiting to complete an activity if those hours are outside business hours. To give a clearer picture of the process, we can adapt an established technique for Calculating Business Hours Using DAX, as written about previously by Matt Allington. Our event log has events happened between 9AM and 5PM, 7 days a week, so we’ll include weekends as Matt has done in his example (we will also not remove public holidays for simplicity).
VAR WorkDayStart =
TIME ( 9, 0, 0 ) // 9AM
VAR WorkDayEnd =
TIME ( 17, 0, 0 ) // 5PM
VAR BusinessHoursPerDay =
VALUE ( WorkDayEnd - WorkDayStart ) * 24
VAR PreviousDate =
DATEVALUE ( 'Event Log'[Timestamp of previous Activity] )
VAR PreviousTime =
TIMEVALUE ( 'Event Log'[Timestamp of previous Activity] )
VAR CurrentDate =
DATEVALUE ( 'Event Log'[Timestamp] )
VAR CurrentTime =
TIMEVALUE ( 'Event Log'[Timestamp] )
VAR FullWorkDays =
DATEDIFF (
'Event Log'[Timestamp of previous Activity],
'Event Log'[Timestamp],
DAY
) - 1
VAR FirstDayElapsedHours =
// Work out how many hours before end of day that the previous activity took place
DIVIDE (
DATEDIFF (
'Event Log'[Timestamp of previous Activity],
PreviousDate + WorkDayEnd,
// 5PM on day of previous activity
SECOND
),
60 * 60
)
VAR LastDayElapsedHours =
// Work out how many hours into the day the current activity took place
DIVIDE (
DATEDIFF (
CurrentDate + WorkDayStart,
// 9AM on day of current activity
'Event Log'[Timestamp],
SECOND
),
60 * 60
)
RETURN
IF (
'Event Log'[Timestamp of previous Activity] <> BLANK (),
FirstDayElapsedHours + FullWorkDays * BusinessHoursPerDay + LastDayElapsedHours,
0 // Return 0 for first activity
)
Final considerations
Breaking the steps into separate columns as we have done can help us understand the logic behind the calculation. In practice, you’ll want to consolidate the logic into a single calculated column rather than three, as this avoids storing unneccessary fields 3 . This can be accomplished by replacing the first two calculated columns with variables in the definition of the total hours column.
Once we have the business hours to complete each activity, we can visualise this to see where our process faces the most delays.
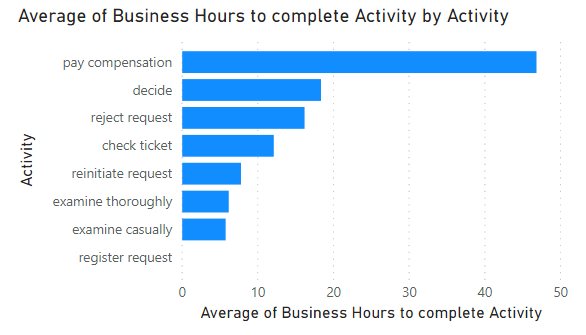
Upon inspection, I wouldn’t consider it particularly surprising that the activity of ultimately paying compensation to customers is the longest step for a reimbursement process. But there are other insights to note here as well — for example, the duration of the ‘examine casually’ and ‘examine thoroughly’ appear to take about the same amount of time on average. In reality, the ‘examine casually’ activity is undertaken for all cases, but sometimes they are then examined more thoroughly. This is a symptom of the process actually not being a linear one, as different cases may follow a different chain of activities. Techniques have been developed in the field of process mining to address such scenarios, and I imagine they’ll form the topic of future blog posts.
-
The dataset is as described in the book Process Mining: Data Science in Action by Wil van der Aalst, and can be downloaded here. ↩
-
Note that in more complicated processes with branching paths that a process can follow, tracking states may not be so simple. But for the purpose of this article, the assumption of a simple linear process will do just fine. ↩
-
Creating unneeded columns isn’t best practice with Power BI, especially when one of the fields is a datetime. Datetime fields often have a big impact on your file size, as the high cardinality makes it hard for the Vertipaq engine to compress them. ↩