

Top 5 tips to reduce your Power BI data model size
If you’re building Power BI reports on the regular, then you’ve probably built a few reports that are on the large side. My usual rule of thumb is that if a model is getting beyond 100MB in size, then you should probably start thinking about how you can optimise it. Reducing your model size brings both performance improvements and faster upload speeds to the Power BI Service — if you’re working from home, low upload speeds may be a real headache. Waiting half an hour or more for a report to be published can be an issue when you’re facing a deadline, so it’s better to have your report optimised so the upload file isn’t that big to begin with. To that end, here are 5 tips to ensure that your data model can stay compact while still delivering all the insights you need.
1. Remove columns that you don’t need
Okay, this one should be obvious — more columns means more data. There are columns that you’ll absolutely need in your model, but often times there are some that aren’t actually being used at all. I often find that I have unneeded columns in my reports for one of two reasons: either I’m too lazy to remove them (I’m only human), or because I anticipate that I might need it later. It can certainly be tempting to have a full sandbox with all the fields you could possibly need. But I’ve found that whenever I’ve built a sandbox in the past, the complexity of the report becomes a real barrier for making progress.
My preference has become to start building a model with only the bare minimum number of columns required, and only bring in new columns as they’re needed. Every time I add a new column in, I have the opportunity to reflect on whether or not the data is still appropriately modelled for the scenario at hand. As your stakeholders ask for more report features, you may need to remodel to satisfy their requirements, and this practice helps to identify that need earlier on in development.
If you want to easily work out which fields can be removed without breaking your report, you can use tools like this Power BI Field Finder report developed by Stephanie Bruno.
2. Remove or replace columns with high cardinality
Even if you are using a column in your report, it may be worthwhile to remove or replace it. Columns with high cardinality (i.e. they have many unique values) are often responsible for a bloated model, and this is a result of how the Vertipaq engine inside Power BI works. Vertipaq compresses the data model in a column oriented manner, which means that columns with fewer unique values can be easily compressed, but columns with many unique values cannot.
You can inspect how much space each column takes up in the model using Vertipaq Analyzer, which is an embedded feature in DAX Studio. This feature can help you easily identify which columns may be ideal to delete from the model to reduce the file size. For example, the model analysed below has over 80% of it’s file size taken up by an Invoice Line ID column in an Invoice table at line item level. Since this surrogate key is only in a model as a carry-over from the source system, we can reduce our model size by 80% by removing this single column!
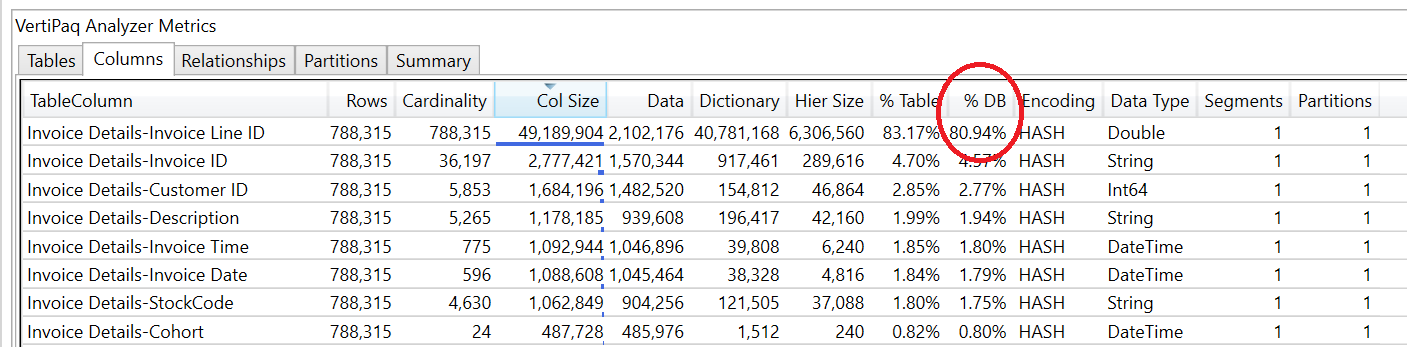
If you’ve never used Vertipaq Analyzer before, SQLBI have a video showing how to Read Performance Analyzer metrics in DAX Studio. 1
However, if you can’t remove high cardinality columns, you may be able to split them into separate columns that give more compression than the sum of their parts. Datetime columns are especially useful to decompose into separate columns for the date and time. 2 But besides splitting the columns, in some scenarios you may prefer to round your datetimes to the nearest minute or hour; I’ve previously written about how you can do this with Power Query.
The technique of splitting high cardinality columns isn’t limited to datetime columns. Gilbert Quevauvilliers has previously written about a novel approach of reducing data model size by splitting a column of decimals into two columns: one for the digits before the decimal point, and one for the digits after. Calculations can then be performed with custom measures that stitch the decimal values back together.
3. Remove rows that you don’t need
Another obvious one. It can be tempting to include a complete dataset with a large date range and every category so users can slice and dice to their heart’s content. But in reality, when decision makers are referring to your reports, they don’t always need to see data before a few years ago. The business context may have significantly changed since then, and including these data may actually tell an inaccurate story if they don’t have that context. 3
If you can’t remove certain date ranges, then you can often omit particular categories, like irrelevant regions or product types. If they’re outside the scope of your analysis, then including these records on the off-chance that your stakeholders might want to report on them may not be worthwhile if report performance is becoming an issue.
You also have the option of aggregating up to a different grain. For example, including hundreds of millions of rows of sales transactions may not be as performant as rolling this up to daily snapshots by product category or store.
4. Turn off Auto Date/Time
One of the things that Power BI does by default in the background is it will automatically generate date dimension tables. These tables define the hierarchy that gets created when you use date fields in visuals, and also help to create time intelligence calculations. In practice, you can usually accomplish all the same things yourself with your own date dimension and time intelligence measures.
A major issue with including these is that a new table is automatically generated for each date column in your model. Each table will contain a row for each of the dates between the earliest and latest dates in the corresponding date field. So if your data warehouse has slowly changing dimensions that use nominal dates like ‘31/12/9999’ to mark the record end date, then not accounting for the Auto Date/Time functionality can lead to large date tables generated in the background. Guy In A Cube have a great video on the impacts of these tables, and how you can reduce a report in size by over a gigabyte (yes, a gigabyte!) just by disabling Auto Date/Time.
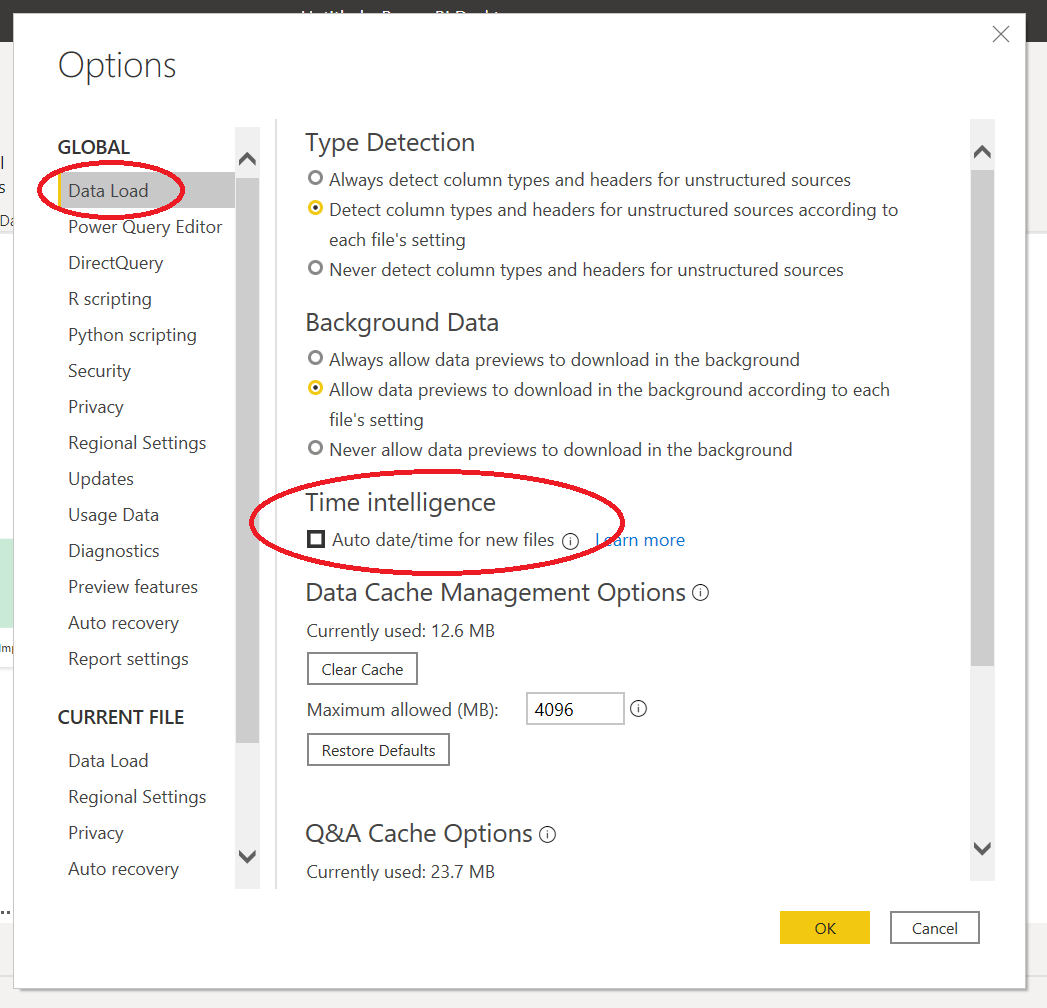
To turn off this feature, simply go to File > Options and Settings > Options. You can turn off Auto Date/Time under Data Load, and have this apply either just to the current report file, or globally to all newly created reports.
5. Create extra columns in Power Query over DAX
As you’re loading queries into your model, the Vertipaq engine determines the optimal partitioning scheme to minimise data model size. However, this optimisation step is performed based only on the columns loaded from Power Query, and not based on any Calculated Columns created in DAX. If the partitioning was determined with these columns in mind, then Vertipaq may be able to compress the full table further, but the engine only performs this step once (before considering any DAX calculations). This means that the partitioning scheme selected by the engine may no longer be the best one, and it can mean that the model takes up more space than it would otherwise.
For this reason, you should create additional columns for your model in Power Query rather than DAX, to ensure that you’re getting as much compression of your data as possible. There are practical exceptions to this rule, such as when your calculations rely on relationships, or when the time to reload your data from Power Query is unreasonably slow compared to adding a single new column in DAX. But in general, your aim should be to push the calculations upstream where you can.
Summary
If you’ve got a large data model, you’ve got a number of options to optimise the model size. You can try each of these and see which is most effective. I’ve found that as I’ve gotten more practice with optimising models, the more quickly I’ve become able to identify which approach will work best. I’ve also found that this practice teaches you to keep these considerations in mind as you build your model, so by learning these best practices you can avoid the need to optimise you model in the first place.
PS: If you’re stumped on where to start with optimisations, Michael Kolvasky at Microsoft has recently released a set of best practice rules for your Power BI model. These rules can be loaded into Tabular Editor, allowing it to scan your model and point out various suggestions to optimise your model, even beyond the approaches we’ve discussed above. Check out this video from Guy in a Cube to see how to use the Best Practice Analyzer in Tabular Editor.
-
In fact, SQLBI have a free online course on using DAX Studio and Vertipaq Analyzer which you should definitely check out if these tools aren’t already part of your Power BI toolbox. ↩
-
Since one year’s worth of datetime values can give you over 31 million distinct values, storing this as datetimes can result in high cardinality. When that same year's worth of values are split into separate date and time columns, you have a total of about 87,000 distinct values across both columns, so they compress much better. ↩
-
Besides, storing all historical data is a job for a data warehouse, not for an individual report. ↩