

Make the transition from Excel to Power BI smoother by emulating PivotTables and PivotCharts
Migrating users from Excel to Power BI can be a challenge. Even users who know their way around a PivotTable may resist the move, despite the similar drag-and-drop experience in Power BI. In this post, I show how you can use Field Parameters to build a visually-similar experience to Excel PivotTables and PivotCharts. This can provide a familiar-looking stepping stone for users who have yet to make the jump over to Power BI for self-service.
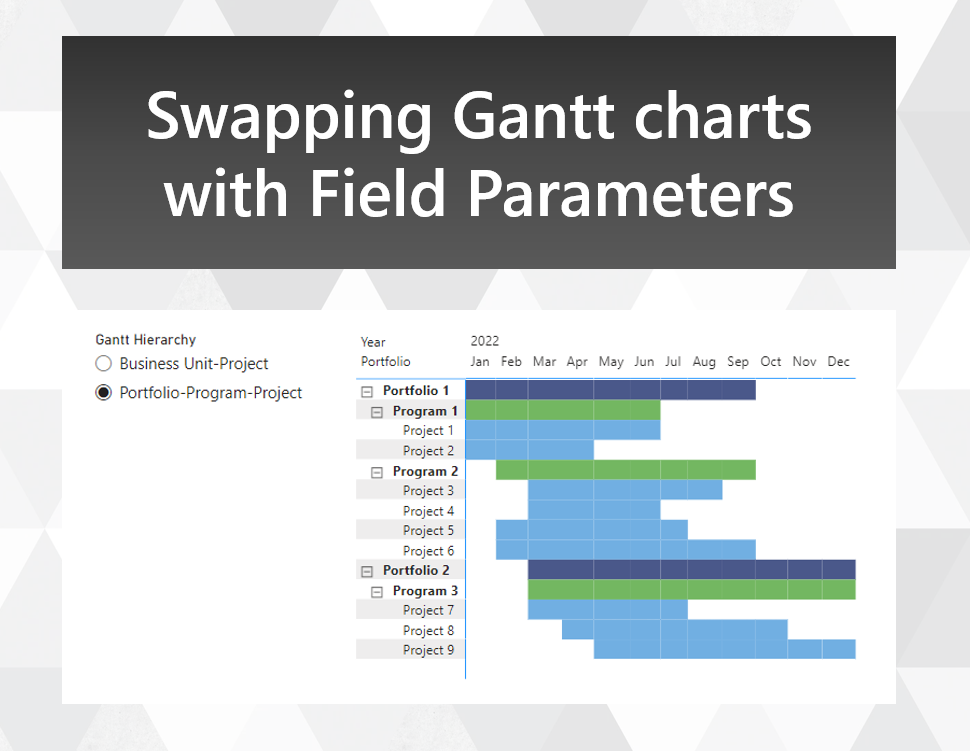
Swapping Gantt chart hierarchies with Field Parameters
With the new Field Parameters feature, you can now change the presentation of your visuals in a number of new ways. One way is to change the order of fields shown in a table or matrix, although the standard application of field parameters for this use case doesn't allow you to enforce a sort order. Here's an approach that allows you to retain your sort order, with an application for creating a Gantt chart of different hierarchies with overlapping members.